🌬️ Air Quality Dashboard
Laboratory air quality monitoring • Generated 2026-10-05 08:42:09
-1_025 Lab (PAM Group)
Temperature
Humidity
CO2
VOC Index
NOx Index
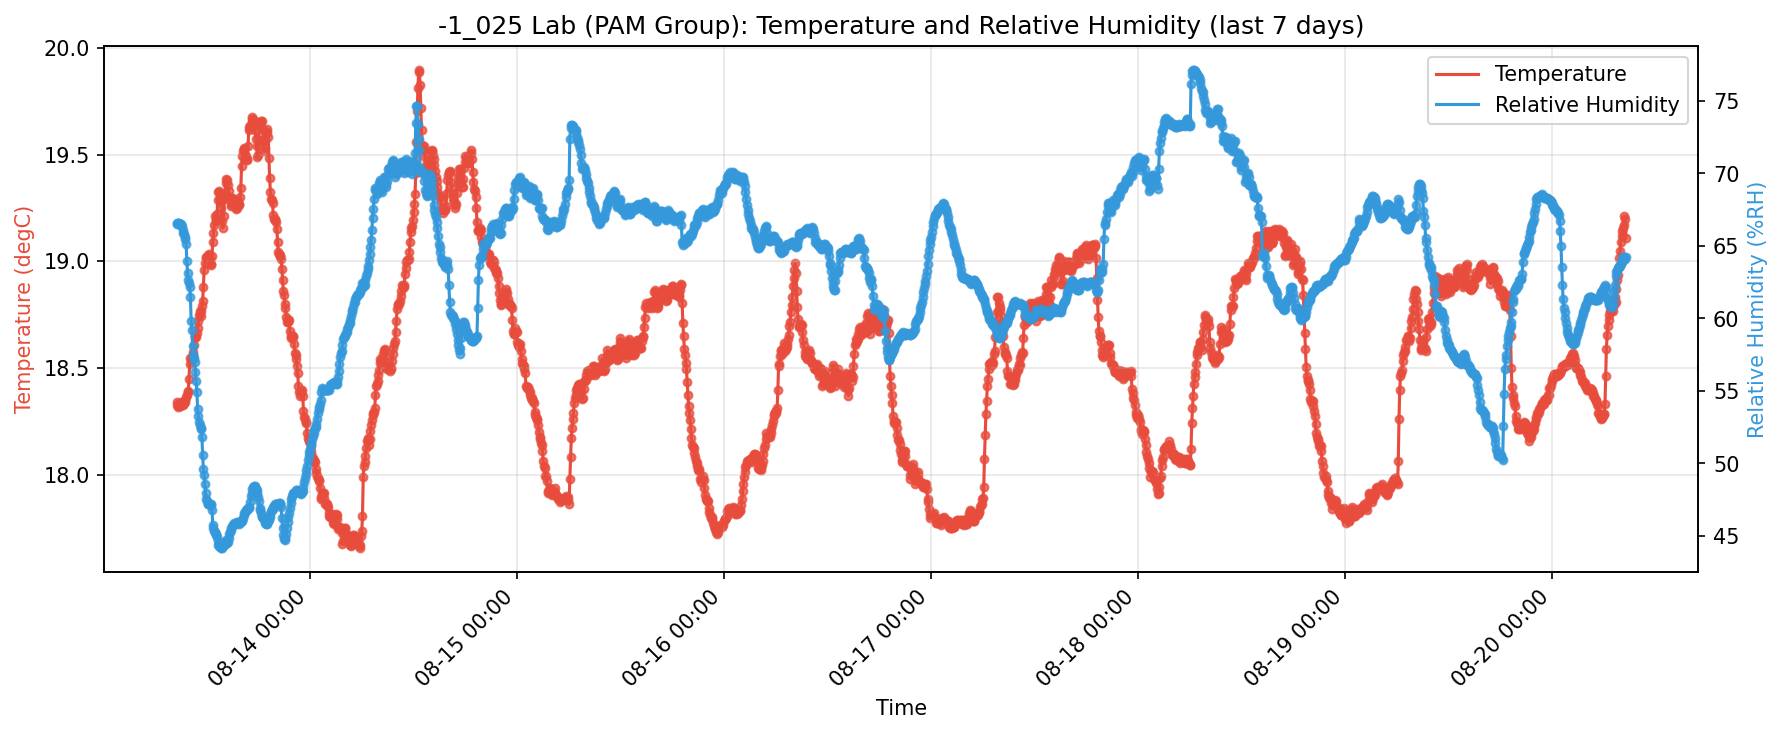
Temperature and Relative Humidity
This plot tracks thermal comfort conditions over time. Sensirion IAQ guidance highlights that many occupants feel comfortable around 20-25 C and 40-60% RH, while persistently high temperature or humidity can worsen indoor air quality.
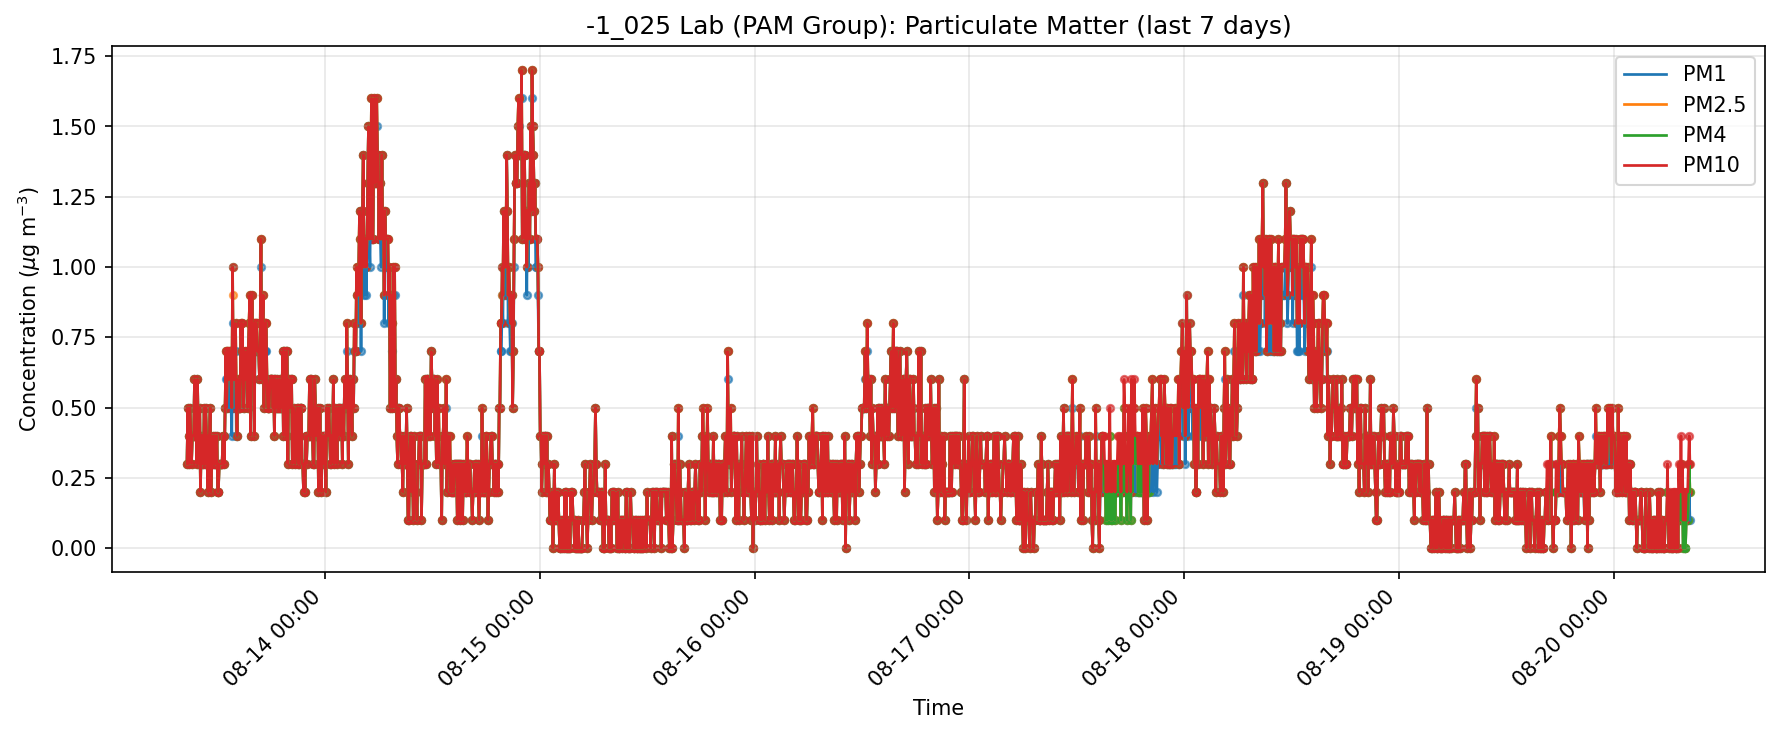
PM1 / PM2.5 / PM4 / PM10
This plot compares particulate levels across size bands (PM1, PM2.5, PM4, PM10). The IAQ brochure notes that smaller particles penetrate deeper into the respiratory system, and PM2.5/PM10 are major contributors to indoor air health risk.
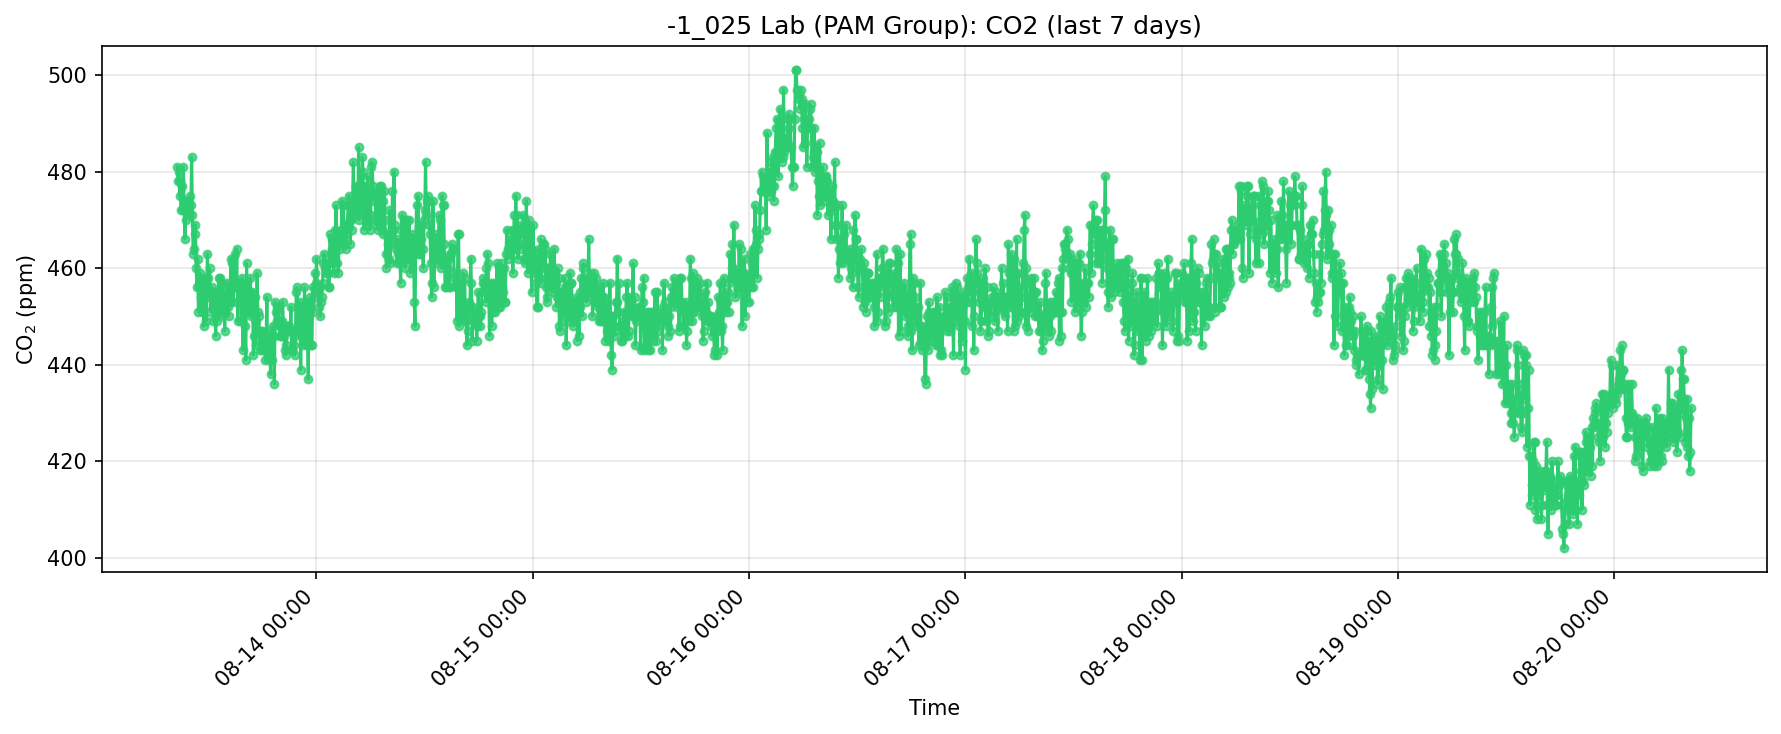
CO2
This plot shows CO2 in ppm as a ventilation and occupancy proxy. Sensirion IAQ material references cognitive-performance impacts as CO2 rises, so sustained elevations can indicate a need for increased fresh-air exchange.
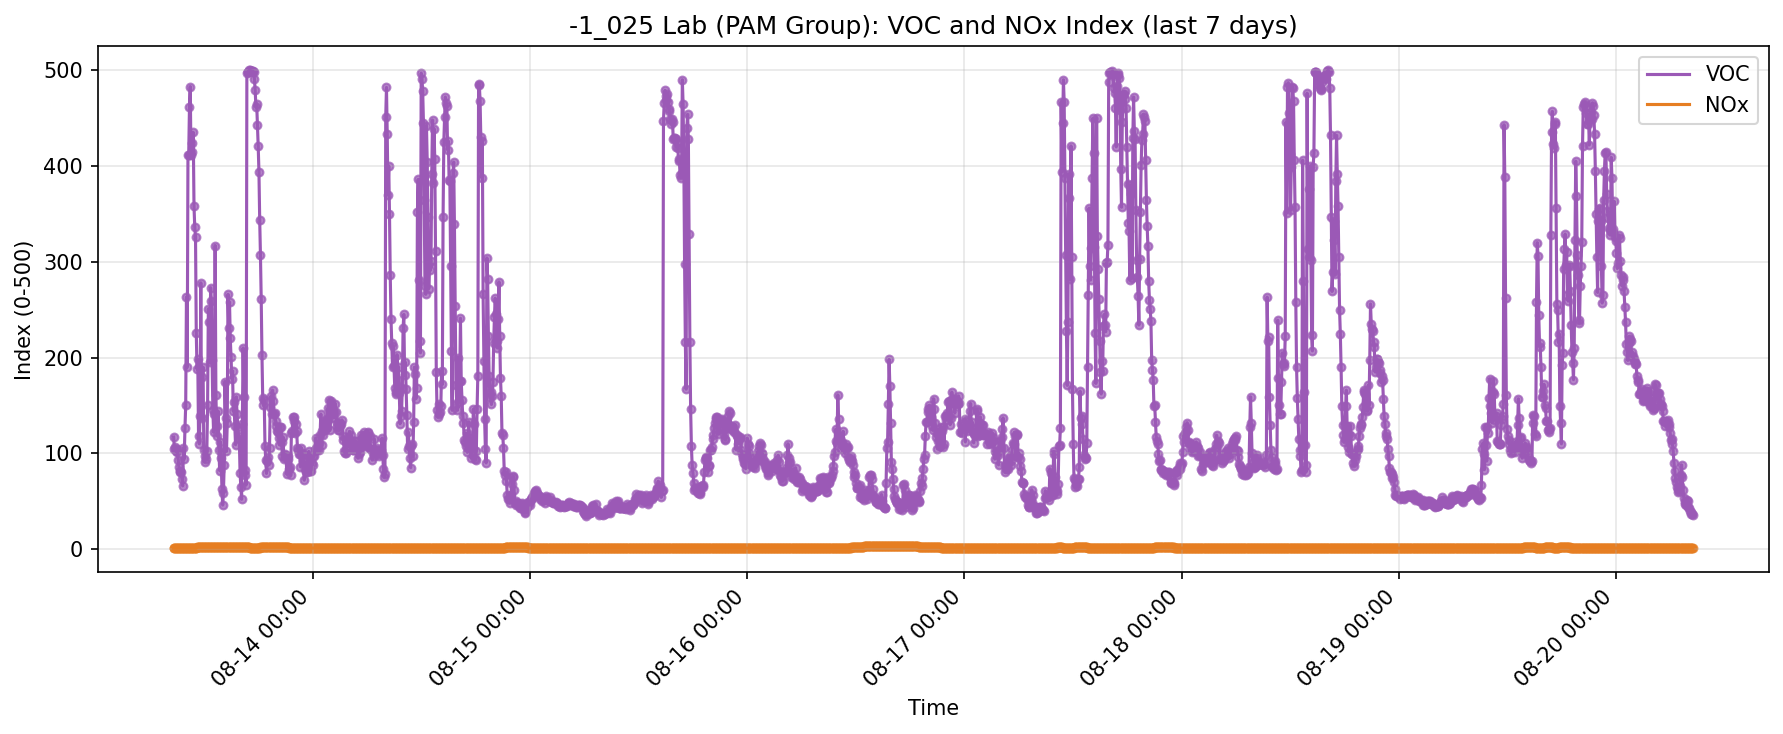
VOC and NOx Index
These are Sensirion relative index signals (not direct concentration): VOC Index is referenced to recent history with a baseline near 100, and NOx Index with a baseline near 1, each on a 1-500 scale. Viewing both together helps distinguish air-quality events such as cleaning/cooking, outdoor infiltration, and fresh-air recovery.